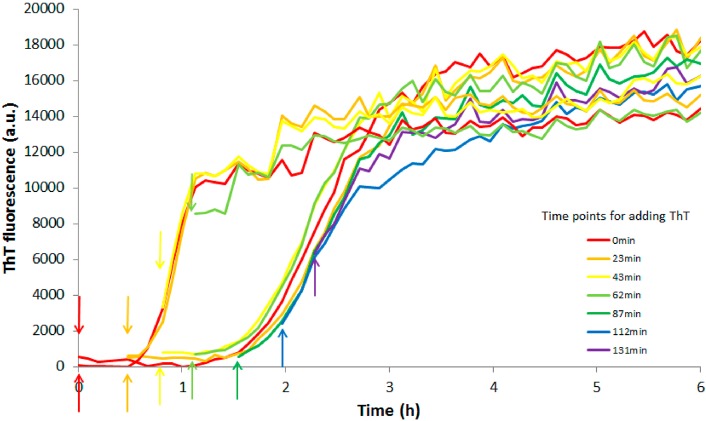
Figure 3.
ThT fluorescence intensity as a function of time for 4 μM Aβ42 wt or F19L. The different colors correspond to the time points when 12 μM ThT is added to each sample. The upper and lower arrows correspond the ThT additions to wt and F19L, respectively. Every color represents an average out of two experiments. All samples contain 20 mM sodium phosphate, 200 μM EDTA, and 0.02% NaN3, pH 8.0. F19L still has a longer half-time than wt even though ThT is added at different time points.

