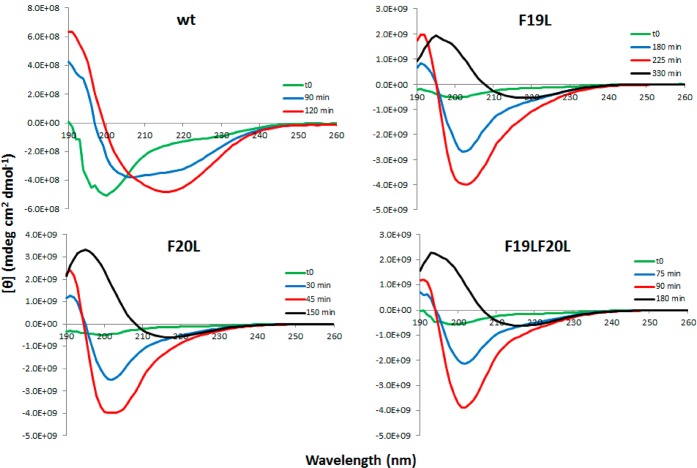
Figure 4.
Far-UV CD spectra for Aβ42 wt and F19L in the upper panels and F20L and F19LF20L in the lower panels at different time points. The concentration of all peptides is 5 μM. All spectra are recorded during continuous stirring, except for the black curves which are at quiescent condition. In all cases, the structure changes from random coil at the beginning of the experiment to β-sheet in the end.

