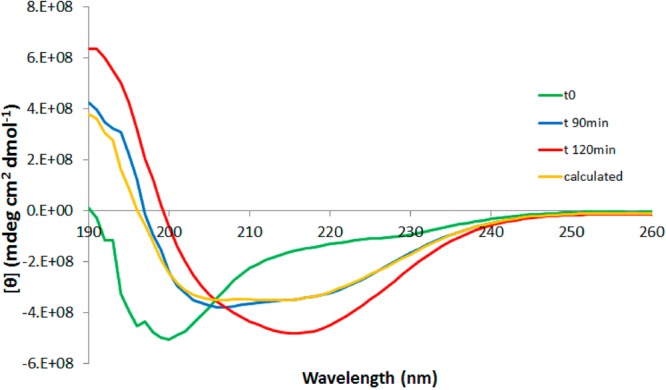
Figure 5.

Far-UV CD spectra of Aβ42 wt. The same spectra as the one shown in Figure 3 with the addition of the orange line, which is generated as a superposition of the spectra at t = 0 and t = 120 min multiplied by 0.41 and 0.59, respectively. The sample at intermediate time (90 min) contains a mixture of unstructured peptide and fibril. No other species are seen.
