
Figure 2.
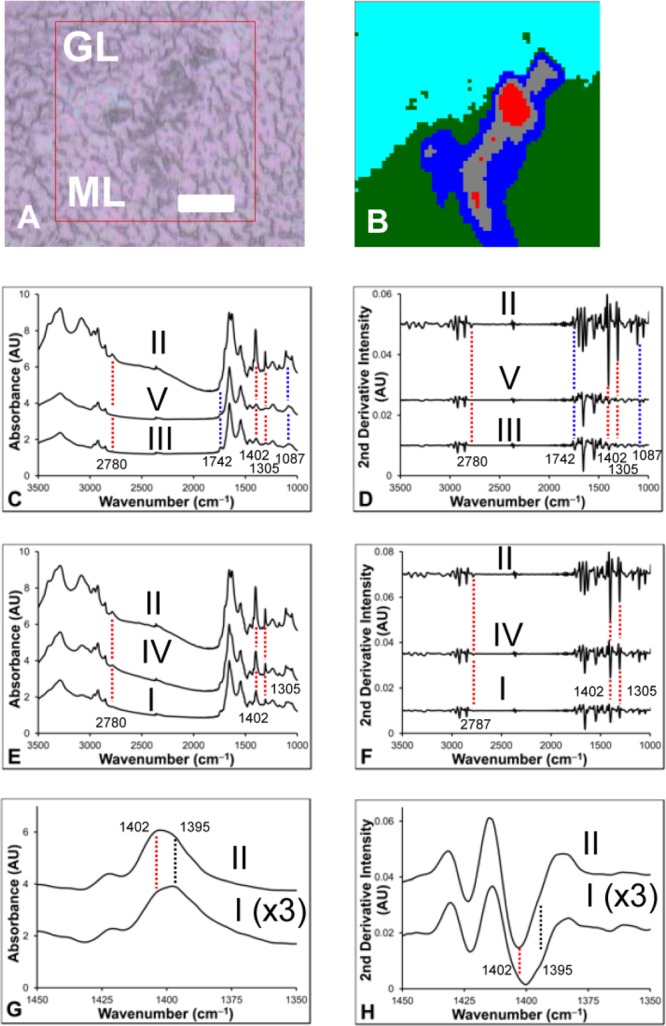
Multivariate analysis (five group K-means cluster) of an FTIR spectroscopic image of a creatine deposit. (A) Optical image. (B) Five-cluster image showing creatine deposit periphery (cluster I, dark blue), creatine deposit center (cluster II, red), molecular layer (cluster III, green), region between center and periphery of the creatine deposit (cluter IV, gray), and granular layer (cluster V, light blue). (C–H) The average spectra (raw, and second-derivative) for each cluster are presented to highlight the spectroscopic differences between the molecular and granular layers of the cerebellum and the creatine deposit (C, D) and within the creatine deposit itself (E–H). Spectra have been offset to clarify the location of spectroscopic differences. The average spectra of cluster I in (G) and (H) has been scaled by a factor of ×3 to highlight the appearance of the shoulder at 1395 cm–1. Blue dashed lines highlight differences between molecular and granular layers. Red and black dashed lines highlight differences within the creatine deposit. Scale bar = 50 μm.