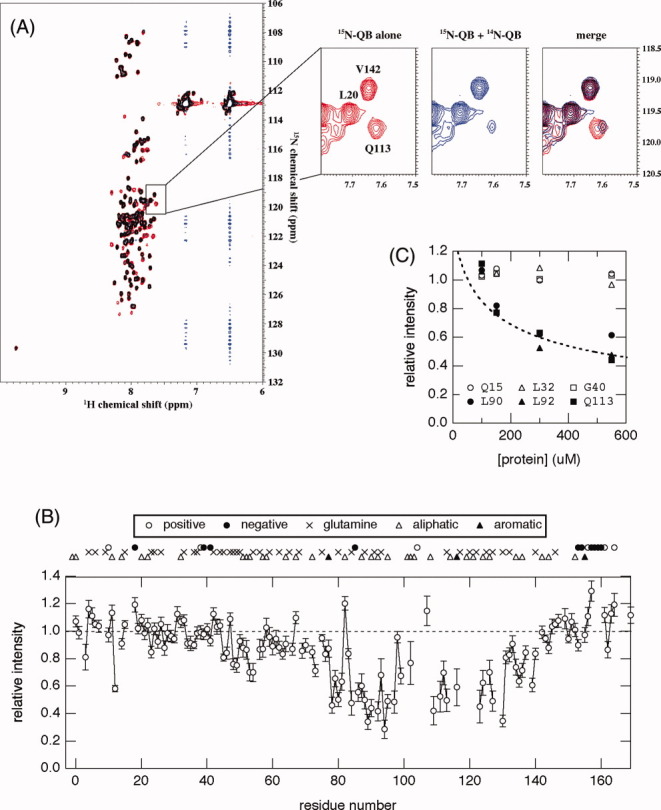
Figure 4.

(A) Overlay of the 1H-15N HSQC spectra of 15N-QB domains in the absence (red) and presence (blue) of unlabeled QB domains at 4°C. Concentrations of 15N-QB were 50 μM in both spectra, and an excess amount (500 μM) of unlabeled QB was added. Expansion of the spectra in a representative region is shown in the right panel. The signal for Q113 showed a dramatic decrease in intensity and a slight upfield shift upon an increase in the total protein concentration. (B) The relative peak intensity of 1H-15N HSQC spectra plotted against the residue number of the QB domain. The intensity in the presence of a 10-fold amount of 14N-protein relative to that in its absence is shown. The positions of glutamine residues as well as several characteristic amino acid residues, positively/negatively charged or hydrophobic, are indicated on the top of the graph. (C) Relative peak intensity of several representative residues plotted against total protein concentration. Samples containing a constant concentration (50 μM) of the 15N-QB domain and various concentrations (50–500 μM) of 14N-QB were prepared, and peak intensity relative to that in the absence of 14N-QB was plotted against the total concentration of protein (15N-QB + 14N-QB). A broken line indicates the relative fraction of monomer at a given total protein concentration on the assumption of a monomer–dimer equilibrium [Eq. (2)] at Ka = 4.5 × 10³ M–1.
