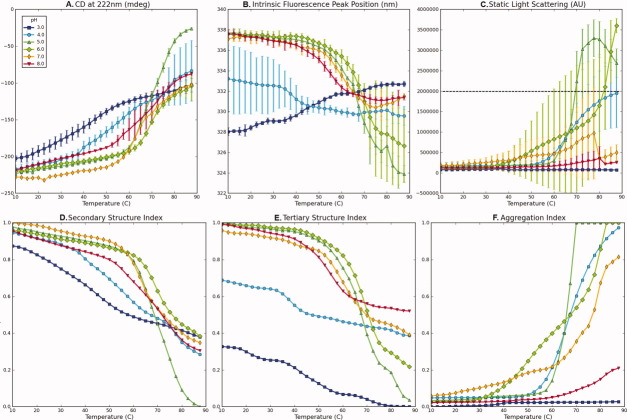
Figure 1.
Experimental data for bovine serum albumin (BSA) measured as a function of temperature at indicated pH values (A–C) and their corresponding structural indices (D–F). (A) CD signal at 222 nm, (B) intrinsic fluorescence peak position, (C) static light scattering at 295 nm, (D) secondary structure index calculated from (A), (E) tertiary structure index calculated from (B), and (F) aggregation index calculated from (C). A dashed line in (C) represents a cut-off value. Data in Figure 1(A–C) were published previously.10

