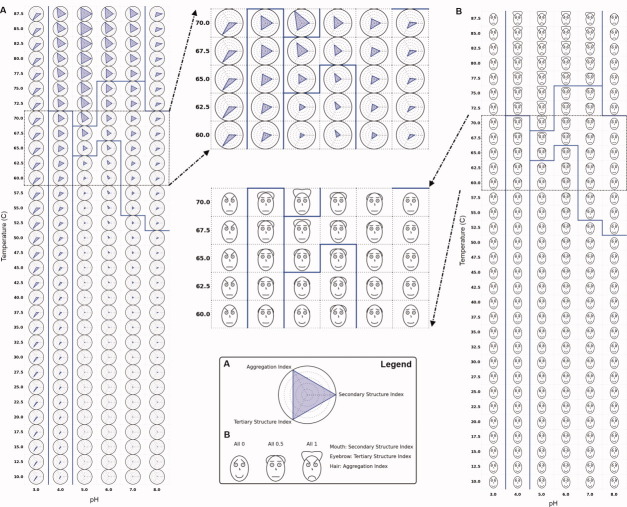
Figure 3.
(A) Radar chart and (B) Chernoff face diagram of the conformational stability of BSA as a function of pH and temperature using data from the three structural indices from Figure 1(D–F). Secondary and tertiary structure indices are inverted for both cases to represent the native state as (A) a dot and (B) a smiling face. Solid blue lines indicate an example of clustering results (see text).

