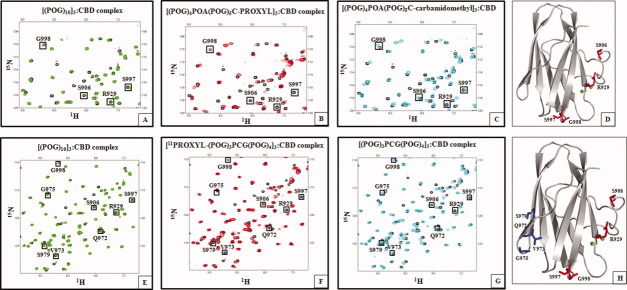
Figure 4.
Titrations of 15N-CBD with spin-labeled minicollagen molecules demonstrate that CBD binds to C-terminal [(POG)3]3 region as well. A: Overlay of the 1H–15N HSQC spectrum of CBD (black) and the 1H–15N HSQC spectrum of [(POG)10]3:CBD complex (green) at 1:1 molar ratio shows no difference in chemical shifts of S906, R929, S997, and G998. B: Overlay of the 1H–15N HSQC spectrum of CBD (black) and the 1H–15N HSQC spectrum of the [(POG)4POA(POG)5C-PROXYL]3:CBD complex (red) at 1:1 molar ratio shows differences in chemical shifts of S906, R929, S997, and G998. C: Overlay of the 1H–15N HSQC spectrum of CBD (black) and the 1H–15N HSQC spectrum of the [(POG)4POA(POG)5C-carbamidomethyl]3:CBD (cyan) at 1:1 molar ratio shows no difference in chemical shifts of S906, R929, S997, and G998. D: Four residues shifted by the spin label of [(POG)4POA(POG)5C-PROXYL]3 are found close to Ca2+-binding site. E: Overlay of the 1H–15N HSQC spectrum of CBD (black) and the 1H–15N HSQC spectrum of the [(POG)10]3:CBD complex (green) at 1:1 molar ratio shows no difference in chemical shifts of S906, R929, Q972, V973, G975, S979, S997, and G998. F: Overlay of the 1H–15N HSQC spectrum of CBD (black) and the 1H–15N HSQC spectrum of the [11PROXYL-(POG)3PCG(POG)4]3:CBD complex (red) at 1:1 molar ratio shows differences in chemical shifts of S906, R929, Q972, V973, G975, S979, S997, and G998. G: Overlay of the 1H–15N HSQC spectrum of CBD (black) and the 1H–15N HSQC spectrum of the [(POG)3PCG(POG)4]3:CBD complex (cyan) at molar ratio of 1:1 shows no difference in the chemical shifts. H: CBD binds to two regions of [11PROXYL-(POG)3PCG(POG)4]3. At 0.2:1 molar ratio, CBD binds to N-terminal [(POG)3]3 resulting in line broadening of S906, R929, S997, and G998 (red). At higher peptide concentrations (0.3:1–1:1 molar ratio), CBD also binds to C-terminal [(POG)3]3, and additional resonances of Q972, V973, G975, and S979 (blue) disappear.

