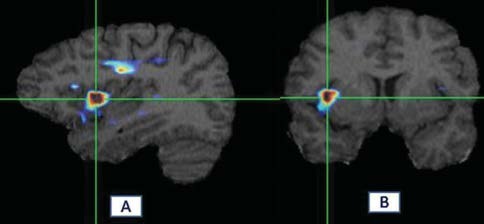
Figure 1.

Fusion of SPECT and MRI in tinnitus-related brain abnormalities in one subject. ROIs were used for semi-quantitative analysis of hyperactivity. (a, b) Abnormalities in inferotemporal gyrus. Hyperactive areas are shown red with BrainAFICS software. Hyperactivity of brain was defined visually and semi-quantitatively analysis. Activity ratio was calculated as follow; for unilaterally involved subjects; after localized abnormal area visually, ROIs were drawn and the count per voxel were compared with the ROIs in the other side or beside. In bilaterally involved subjects; count per voxel of the abnormal areas were compared with similar ROIs on cerebellum (as reference)
