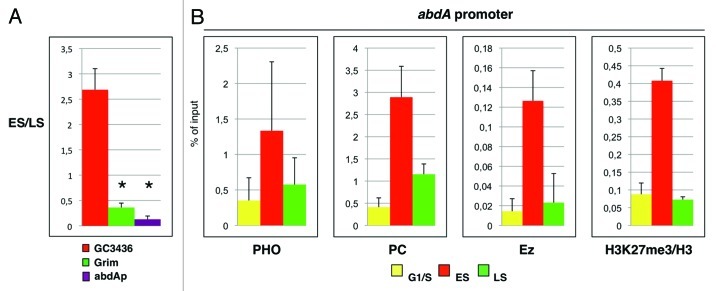
Figure 1. PcG proteins and repressive mark H3K27me3 are enriched at abdA promoter before replication. (A) Replication timing of abdA promoter as measured by quantitative real-time PCR (qRTPCR) in BrdU immunoprecipitated DNA. Ratios between the amplified products in early and late S phase are shown. We amplified positive controls for the early and late S phase in red and green, respectively. Gene names correspond to their entries in FlyBase. All data points were generated from an average of at least three independent experiments. Standard error of the mean is indicated. Two-tailed t-test was applied for statistical analysis. Asterisks indicate statistically relevant differences: 〈 = 0.05. p-values: CG3436/Grim, p = 0.0006; CG3436/abdA promoter, p = 0.0005. (B) ChIP analyses of abdA promoter using indicated antibodies on synchronized cells are presented as percentage of input chromatin. ChIP analysis with antibodies against H3K27me3 were normalized to histone H3 density. Mock enrichment is below 0.003% of the input. Data obtained in HU-treated cells (G1/S) are shown in yellow. Data obtained in cells collected 1 h and 2 h from HU block release (ES and LS) are in red and green, respectively. Each graph shows the result from at least four independent immunoprecipitation reactions done on different chromatin preparations. Standard error of the mean is indicated.

An official website of the United States government
Here's how you know
Official websites use .gov
A
.gov website belongs to an official
government organization in the United States.
Secure .gov websites use HTTPS
A lock (
) or https:// means you've safely
connected to the .gov website. Share sensitive
information only on official, secure websites.
