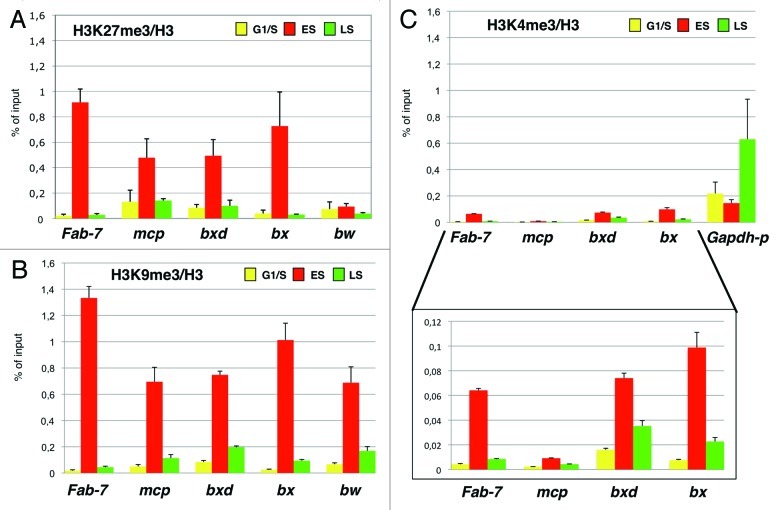
Figure 2. Active and repressive histone marks are inherited simultaneously during replication. ChIP analysis are presented as percentage of input chromatin precipitated for each region normalized to histone H3 density. Mock enrichment is below 0.003% of the input. Data obtained in HU-treated cells (G1/S) are shown in yellow. Data obtained in cells collected 1 h and 2 h from HU block release (ES and LS) are in red and green, respectively. (A–C) ChIP analysis on PREs using antibodies against H3K27me3, H3K9me3 and H3K4me3, respectively, on synchronized cells. As a negative control, we used the promoter region of brown (bw) that is repressed in S2 but it is not under the control of PcG proteins.28 Each graph shows the result from at least four independent immunoprecipitation reactions done on different chromatin preparations. Standard error of the mean is indicated. Magnification with adjusted scale is presented below (C) to highlight H3K4me3 mark dynamics during replication.

An official website of the United States government
Here's how you know
Official websites use .gov
A
.gov website belongs to an official
government organization in the United States.
Secure .gov websites use HTTPS
A lock (
) or https:// means you've safely
connected to the .gov website. Share sensitive
information only on official, secure websites.
