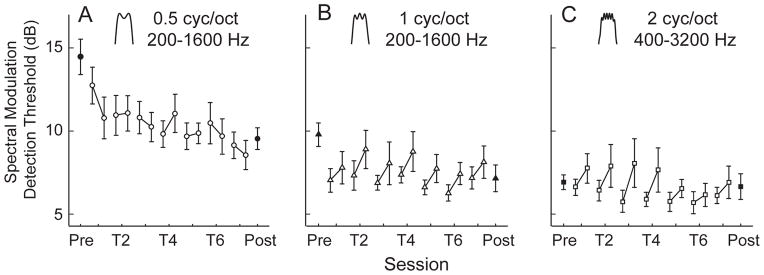
Figure 4. Within-Session Performance.
The group-average spectral modulation detection thresholds from the beginning and the end of each training session. The averages of the first three (left open symbols) and last three (right open symbols) threshold estimates from the same training session are connected by a line. The average pre- and post-training thresholds are also shown (filled symbols). The results are plotted separately for the 0.5- (A, circles), 1- (B, triangles), and 2- (C, squares) cyc/oct trained listeners. Error bars indicate one standard error of the mean. The 0.5-cyc/oct trained listeners showed no consistent within-session performance change, while the 1- and 2- cyc/oct-trained listeners consistently got worse within each session.

