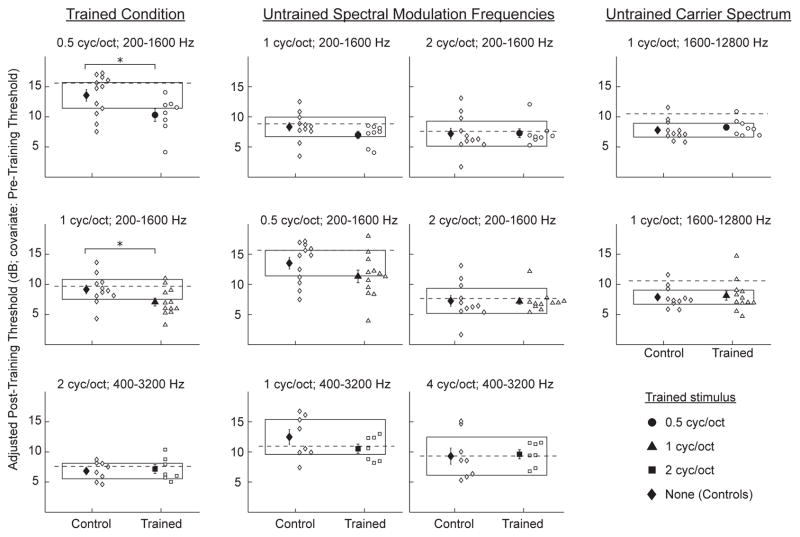
Figure 5. Untrained Spectral Modulation Detection Conditions.
Post-training spectral modulation detection thresholds for each tested condition for the 0.5- (circles; top row), 1- (triangles; middle row), and 2- (squares; bottom row) cyc/oct trained listeners as well as for the controls (diamonds). Results are shown for the group averages (filled symbols) and the individual listeners (unfilled symbols). The thresholds were adjusted using pre-training performance as a covariate. The horizontal boxes represent the 95% confidence interval of the post-training performance of the controls, and the dashed lines represent the mean pre-training performance across groups. Error bars indicate one standard error of the mean. Asterisks indicate a significant (p < 0.05) difference between trained listeners and controls based on an analysis of covariance using pre-training performance as a covariate. Performance was evaluated for the trained condition (left column), untrained spectral modulation frequencies (middle columns), and an untrained carrier spectrum (right column). The top right panel is for both an untrained spectral modulation frequency and an untrained carrier spectrum. There were no untrained conditions on which trained listeners distinguished themselves significantly from controls.

