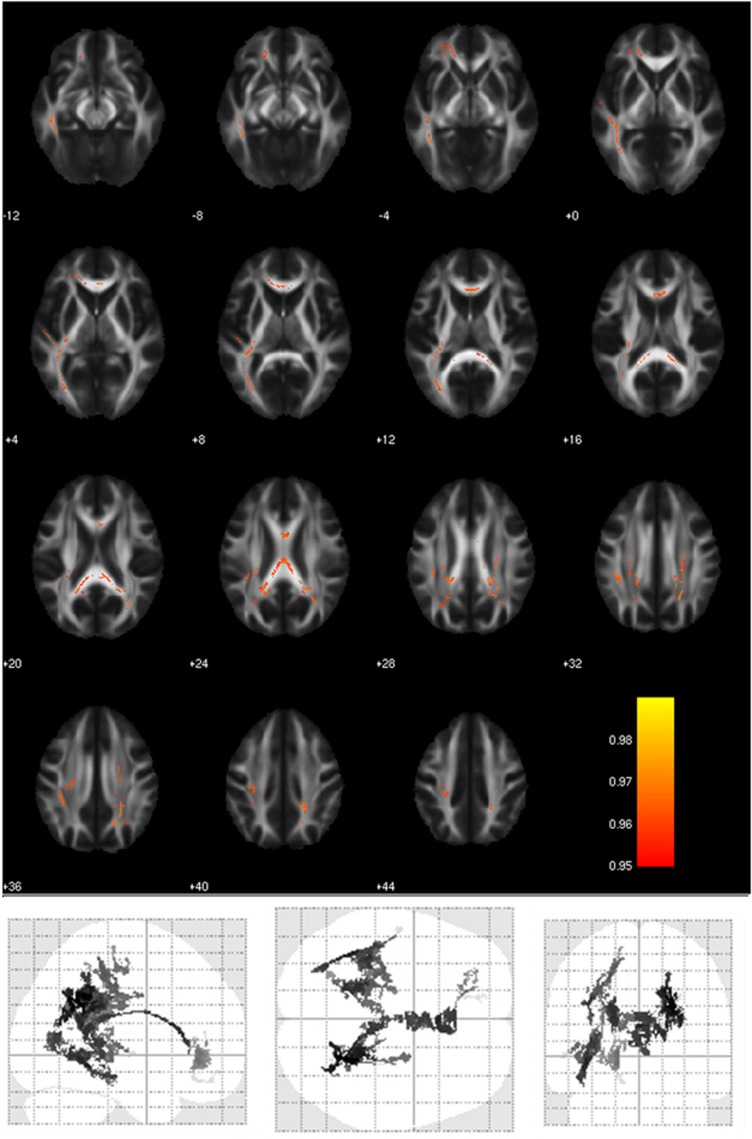
Figure 3.
WM areas where duration of lithium treatment significantly correlated with higher AD. Voxels of significant positive correlation are mapped on the mean FA template of the studied sample and are shown in glass-brain images. The color bar refers to 1−p values for the observed differences. Numbers are Z coordinates in the standard MNI space.

