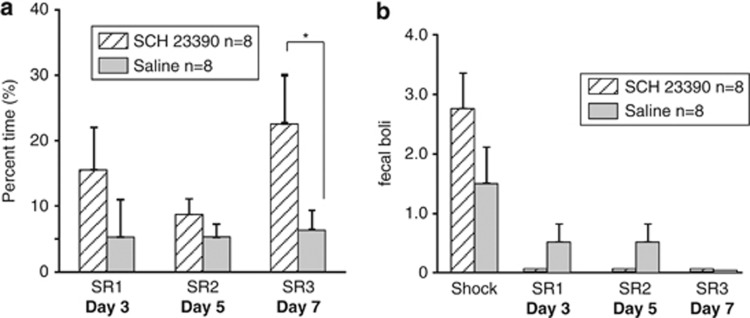
Figure 5.
Behavior during SRs of D1-receptor antagonist injected animals. (a) Percent time in shock compartment. Fraction of time spent in the shock compartment during SRs. (b) Fecal boli count. Number of fecal boli excreted during shock and SRs. All graphs are means plus SE (two-way repeated measures ANOVA, **p<0.01,*p<0.05).

