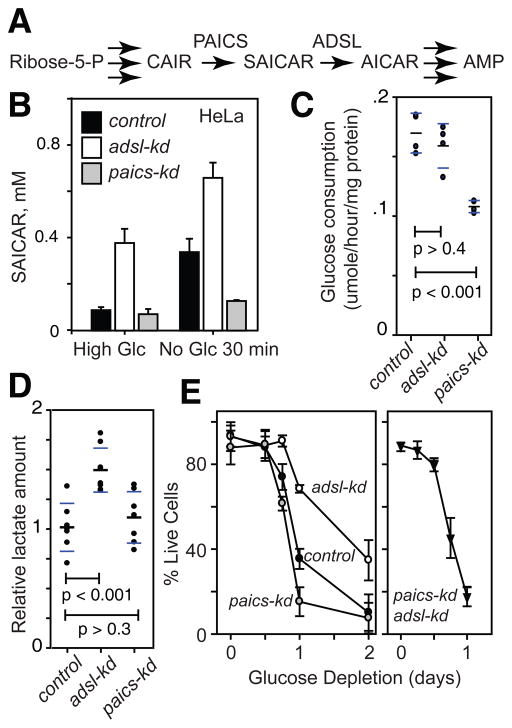
Fig. 3.
SAICAR level affects glucose metabolism, cancer cell survival, and proliferation. (A) A schematic diagram showing in the synthesis and metabolism of SAICAR. (B) Cellular levels of SAICAR in HeLa control-kd (black box), adsl-kd (open box), and paics-kd (gray box) before and after 30 min incubation in glucose-free media. Avg.±s.d. (n = 3). (C and D) Effect of SAICAR on (C) glucose uptake and (D) lactate fermentation. The amount of glucose and lactate in the media was measured using enzymatic assays and LC-MS analysis, respectively (normalized with total cellular protein concentration). Black and blue bars note avg. and s.d, respectively. (E) Survivals of HeLa control-kd (control; cells transfected with random shRNA vector), adsl-kd, paics-kd, and paics-kd adsl-kd cells in glucose-free media were measured using a Trypan blue exclusion method. Avg±s.d. (n=3, where >50 cells were counted to calculate % live cells in each measurement).

