
Figure 1. Fluorescence light microscopy of VipA-sfGFP.
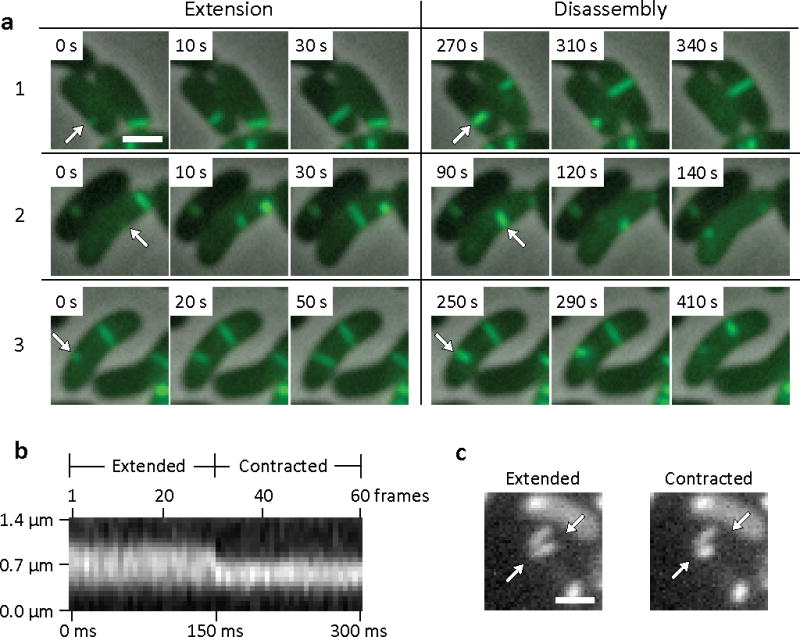
(a) Individual 3×3 μm frames from a time-lapse imaging with a frame rate of 10 sec per frame show 3 frames of extension of VipA-sfGFP structure in ΔVipA background from one side of the cell to another (arrows) followed by a contraction event and apparent disassembly (shown on 3 frames) of the contracted VipA-sfGFP structure (arrows). Bar shown on the first frame represents 1 μm. The whole 10 minute time-lapse sequence is shown in Supplementary Video 1 together with another 17 similar events, larger field of cells is shown in Supplementary Video 2. (b) Kymogram illustrating rapid change in the length of VipA-sfGFP structure. Projection of signal intensity in time at a rate of 200 frames per second along the axis of the maximal intensity on an extended structure (30 frame average shown on the panel (c) left) showing a contraction in length and increase in maximal intensity of the contracted structure (30 frame average shown on the panel (c) right). Arrows indicate contracting VipA-sfGFP structure and mark start and end of a line for generating the kymogram. Bar shown on the average frames is 1 μm long. Gaussian blur filter (sigma radius = 1) was applied to individual frames prior to generating the kymogram. All 60 frames of the time-lapse sequence are shown in Supplementary Video 3 (video segment number 3) together with 4 more contraction events imaged at the same or lower frame rate.