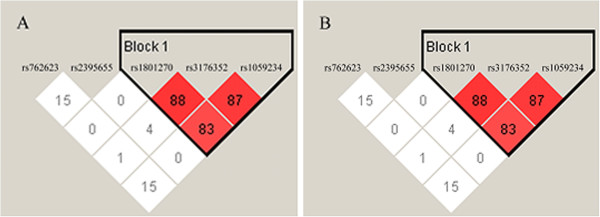
Figure 1.

Linkage disequilibrium (LD) plot and block structure of five p21 SNPs in 393 cervical cancer patients (A) and 434 cancer-free controls (B) showing LD of three SNPs. In both groups, the haplotype block is based on confidence intervals D’. Each diamond represents the pairwise magnitude of LD, with red indicating strong LD (D’ > 0.8) and logarithm of odds score (LOD) ≥ 2.0.
