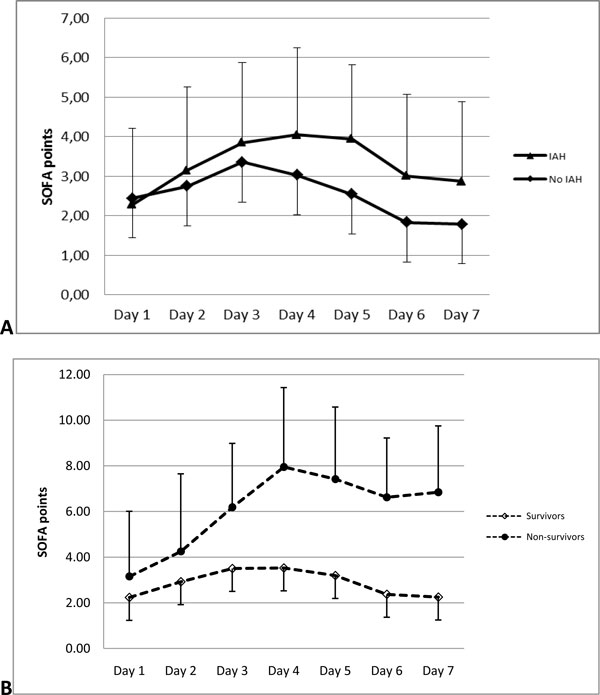
Figure 1.
Dynamics of SOFA score. (A) Patients with IAH and normal IAP in whole group. Significant difference on day 4 (p = 0.04), day 5 (p = 0.01) and day 6 (p = 0.04). (B) Survivors and non-survivors in whole group. Significant difference on day 3 (p = 0.004), day 4 (p = 0.001), day 5 (p = 0.0006) and day 6 (p = 0.0008).

