Figure 1.

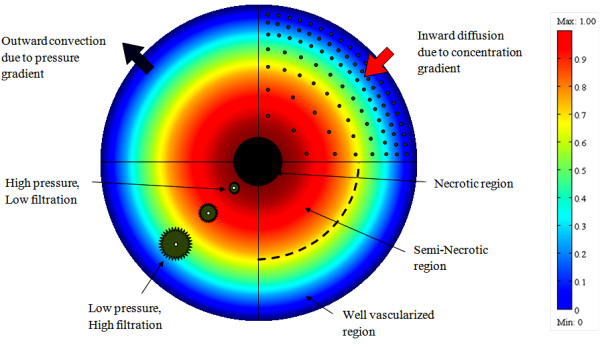
Cross sectional schematic of a solid tumor that shows the three different regions of a solid tumor, IFP distribution, drug concentration and filtration distribution from blood vessels[14], doi: 10.1371/journal.pone.0020344.g001.

Cross sectional schematic of a solid tumor that shows the three different regions of a solid tumor, IFP distribution, drug concentration and filtration distribution from blood vessels[14], doi: 10.1371/journal.pone.0020344.g001.