
Figure 6.
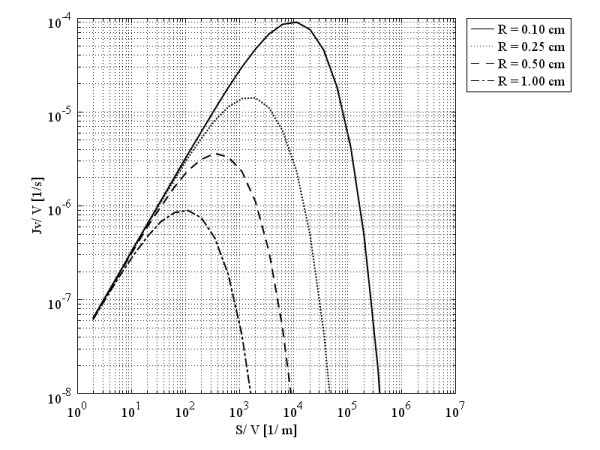
Liquid source per tissue volume at the tumors’ center, as a function of surface area per unit volume.
Official websites use .gov
A
.gov website belongs to an official
government organization in the United States.
Secure .gov websites use HTTPS
A lock (
) or https:// means you've safely
connected to the .gov website. Share sensitive
information only on official, secure websites.
Liquid source per tissue volume at the tumors’ center, as a function of surface area per unit volume.