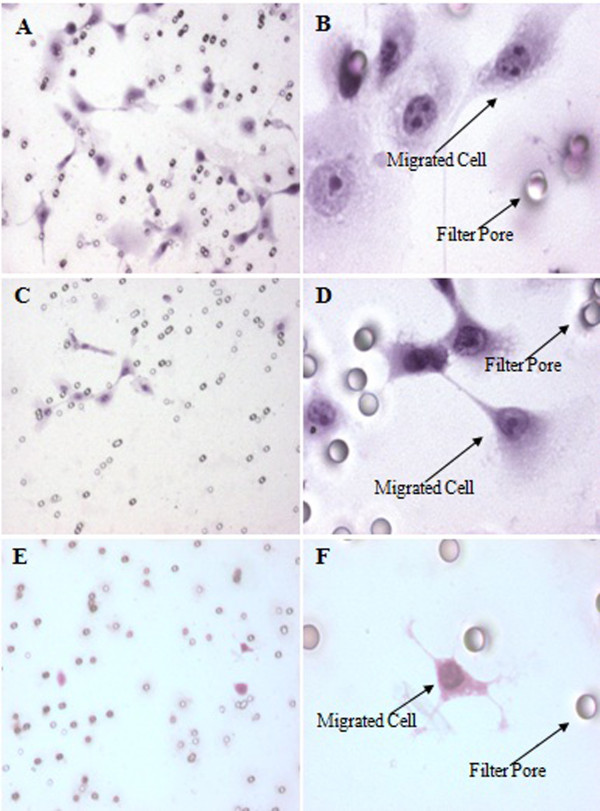
Figure 5.
Matrigel Invasion Assay of MBC1 and MBC2 Cell Lines as Compared to MCF-7. Panels (A) and (B) show the invasion activity of MBC1, and panels (C) and (D) indicate the invasion activity of MBC2. Panels (E) and (F) demonstrate the invasion activity of MCF-7 as positive control. Magnification of panels A, C &E is 10X; B, D &F is 40X.

