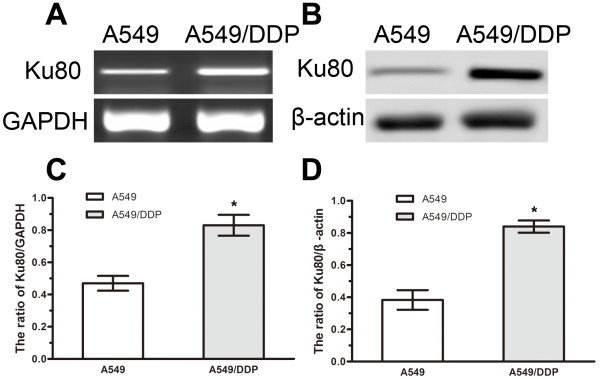
Figure 4.
Expression of Ku80 in A549 and A549/DDP cells. (A) RT-PCR analysis of Ku80 mRNA in A549 and A549/DDP cells. (B) Western blot analysis of Ku80 protein in A549 and A549/DDP cells. (C) Quantification of Ku80 mRNA level relative to GAPDH. (D) Quantification of Ku80 protein level relative to β-actin. Data represented mean ± SD for three replicate experiments. *P < 0.05.

