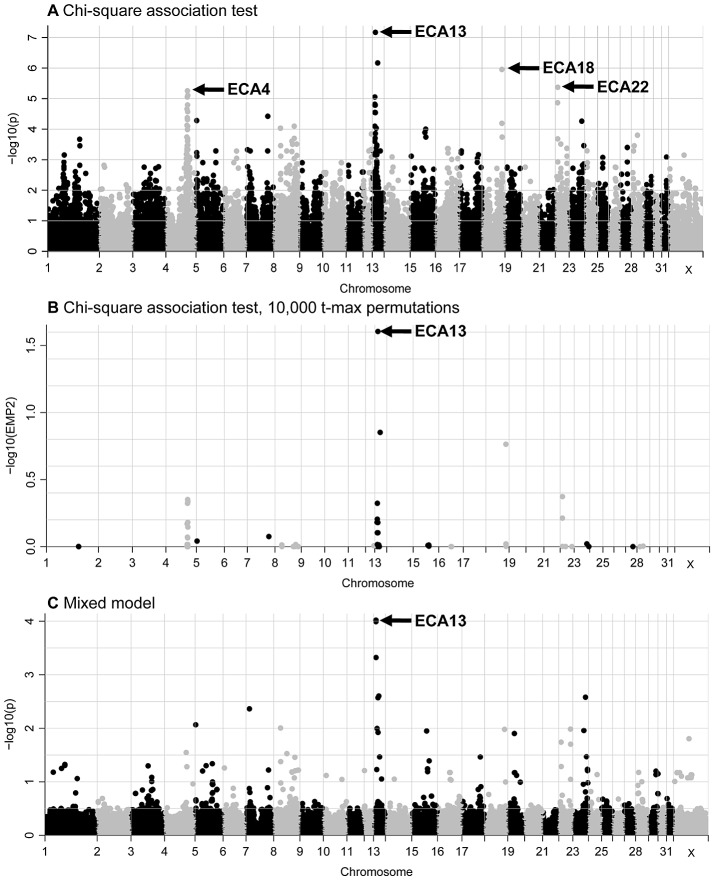
Figure 1. GWAS plots for the IAR phenotype displaying results for the 52,583 SNPs that passed quality control.
(A) standard chi-square based association test without permutations; (B) standard association test after 10,000 t-max permutations, and (C) mixed-model test. The SNPs are plotted according to their position on each chromosome (x-axis) and association with the IAR phenotype (y-axis). Significance is given as the −log10 of the uncorrected (A and C) or corrected (B) P-value. The genome-wide significance threshold is log10 P>5 or log10 EMP2>1. 5.

