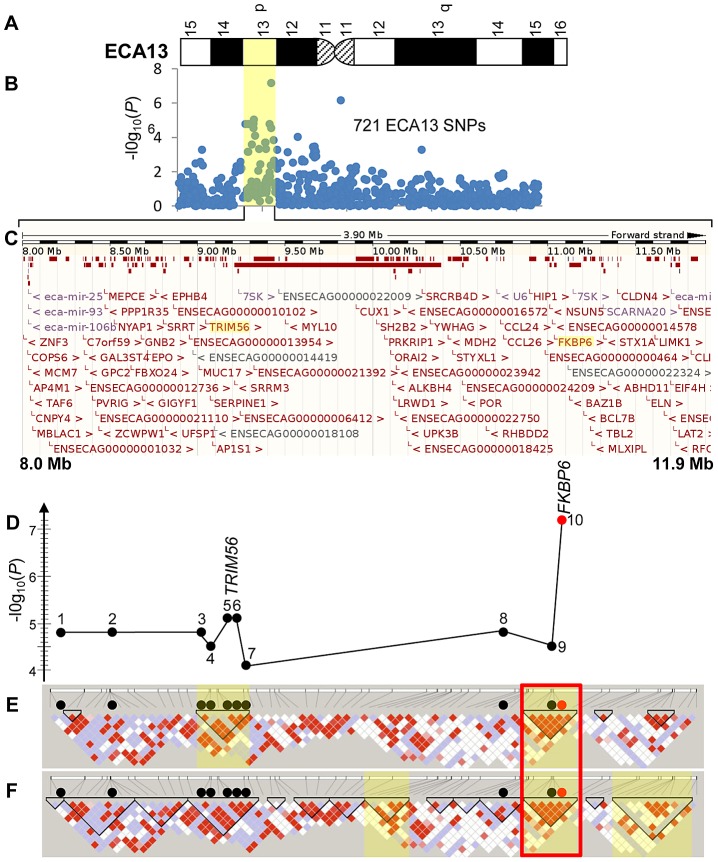
Figure 2. Schematic of the IAR–associated region in ECA13p.
(A) A G-banded ideogram of ECA13 (ISCNH, 1997) showing the cytogenetic location of the IAR associated region; (B) Statistical significance values for 721 ECA13 SNPs analyzed for genome wide association using chi-square; yellow shade highlights the IAR-associated ∼3.9 Mb region; (C) Sequence map of chr13:8,000,000–11,900,000 showing all ENSMBL annotated genes in the region; TRIM56 and FKBP6 are highlighted. (D) A graph showing chi-square test −log10(P) values for 10 significant SNPs: 1–8027172, 2–8382955, 3–8977804, 4–8987922, 5–9034435, 6–9034502, 7–9183989, 8–10894213, 9–11043916 (black circles), and 10–11044175 (red circle); the seven SNPs above the grey line showed moderate significance also in mixed model; (E) Confidence interval LD blocks; (F) Solid spine LD blocks; blocks with significant permuted P-values (P<0.0005) for association with IAR are highlighted yellow; red diamonds represent D′ values equal to 1, lower values of D′ are presented in blue and white; the ∼306 kb highly associated haplotype in both LD analyses is in a red box.

