
Figure 3. The Edge-length Abundance Distribution (EAD) follows an approximately power-law distribution.
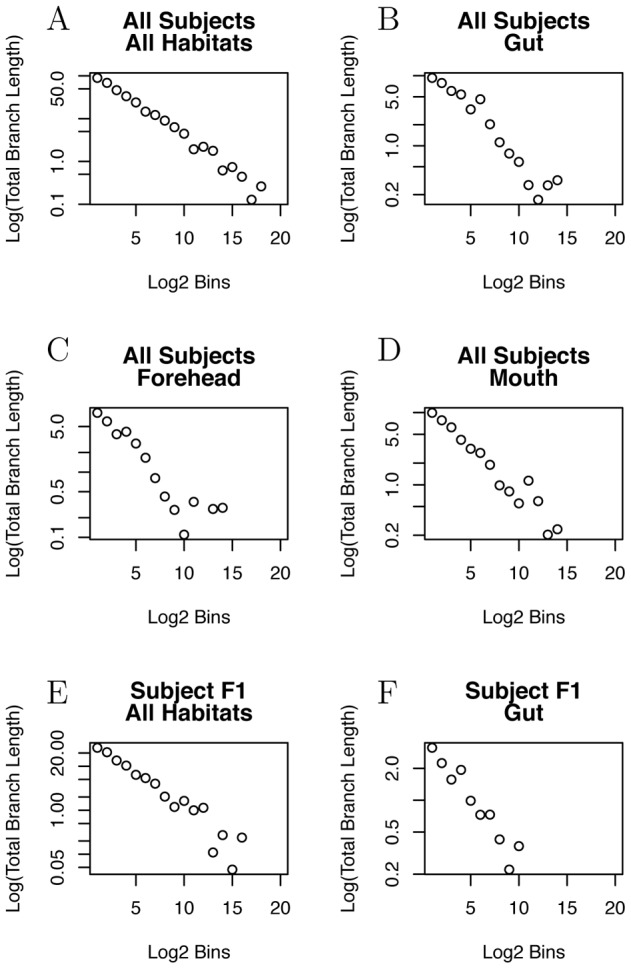
Here we compute the EAD for trees inferred from 16S bacterial microbiome sequences using FastTree [47], for sequences obtained from 7 human subjects across 26 different habitats on a single sample date [11]. On the y-axis is total edge-length summed across all edges with a given number of downstream tips (see Figure 2) and on the x axis is number of tips grouped into  bins, a method commonly used in plotting Species Abundance Distributions [15]. (A) Sequences from all individuals across all body habitats (B–D) Sequences taken from different habitats pooled from all seven subjects. (E–F) Sequences taken from a single subject.