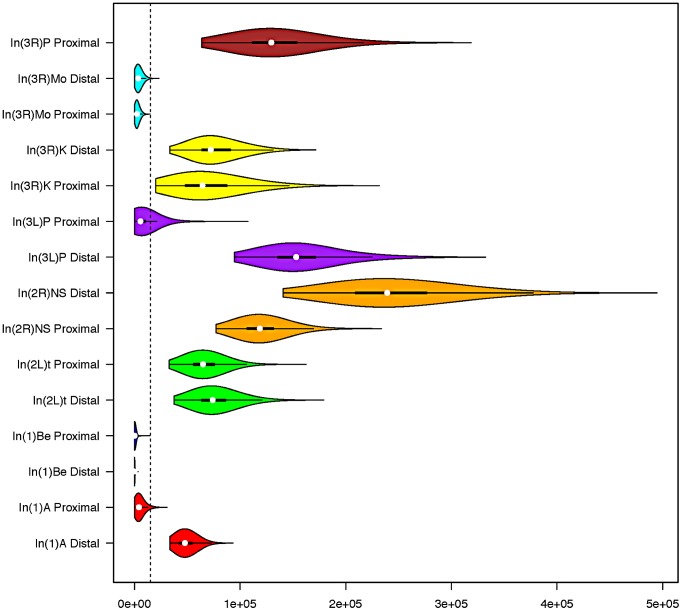
Figure 2. Standard box and whisker plots, with overlaid density kernels depicting the posterior distribution of polymorphism-based age estimates of each inversion breakpoint.
Distributions that share a color indicate they are from different breakpoints of the same inversion. The dashed vertical line represents the approximate timing of the out of Africa migration (15,000 years) [22]. In(3R)P's proximal breakpoint is excluded from all analyses because genetic exchange appears extensive and we cannot confidently identify the original haplotype that the inversion captured.

