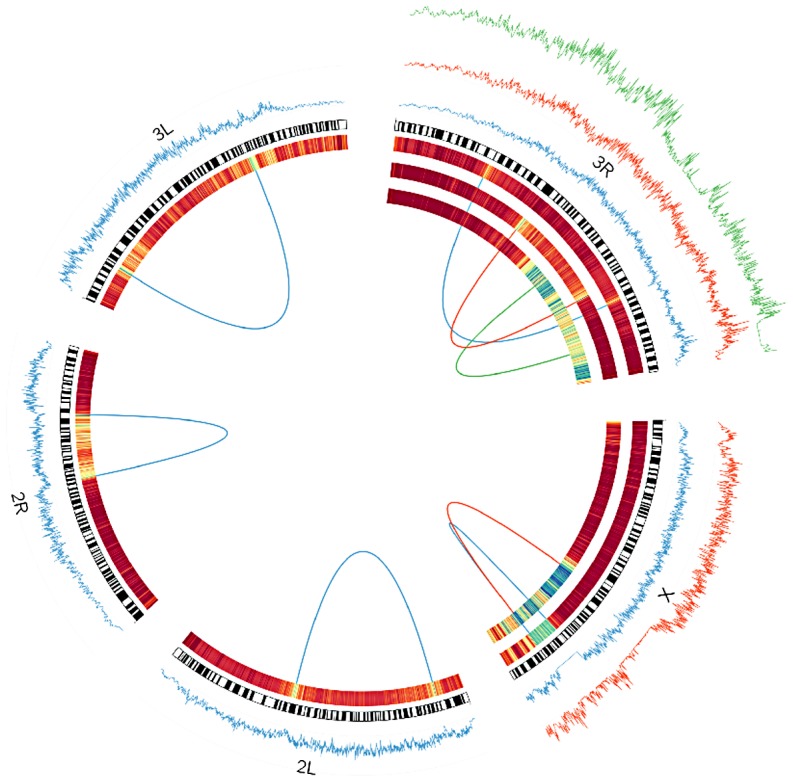
Figure 3. Windowed π among inverted chromosomes (tracks on the outside), and F ST between inverted and standard arrangments (expressed as a heatmap on the inside) for each inversion studied as a part of this project.

In the heatmap, blue corresponds to FST of approximately.5. Dark red is zero. Windows are in units of 1000 segregating sites. Breakpoints of each inversion are shown as a line connecting each breakpoint. In(3R)Mo is based on samples from the Raleigh, NC population. All others are based on comparisons of inverted and standard haplotypes within African D. melanogaster samples. Standard arrangement-bearing haplotypes were filtered for putatively admixed regions identified by Pool et al. [19] prior to all analyses. On the X chromosome, In(1)Be is shown in blue and In(1)A is in red. On 3R, In(3R)Mo is in green, In(3R)K is in blue and In(3R)P is in red. Although the inversions depicted have reversed the order of the segment between breakpoints, this figures displays these regions as collinear to the standard reference sequence for simplicity of comparison.
