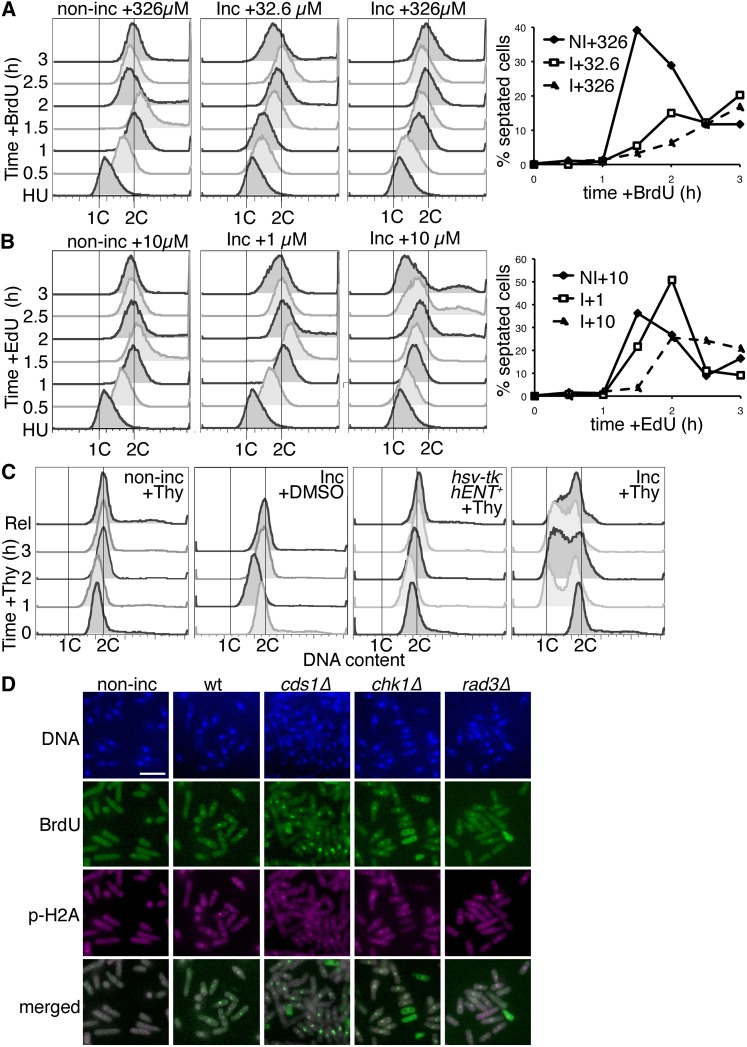
Figure 3 .
BrdU and EdU cause prolonged DNA synthesis, cell-cycle slowing, and DNA damage. (A) DNA synthesis profiles of wild-type nonincorporating (non-inc) and incorporating (Inc) cells, out of hydroxyurea arrest (HU), released into medium with 32.6 or 326 µM BrdU to detect DNA replication. Left, whole-cell DNA content (SytoxGreen) FACS profiles. Right, septation index for non-inc (NI) and Inc (I) cells stained with aniline blue and DAPI, at different BrdU doses (µM). (B) As in A, cells released from HU were released into medium with 1 or 10 µM EdU. Left, FACS profiles of whole-cell DNA content. Right, septation index at different EdU doses (µM). (C) Asynchronous (AS) cells were treated with 2 mM thymidine (+Thy) or DMSO (vehicle control) for 3 hr (32°) and then released for 0.75 hr. DNA content (SytoxGreen FACS) for each time point, analyzed by FACS, is shown at each point. DMSO control was to test response to DMSO only and was not released. Similar results were seen with aqueous thymidine solution (not shown). (D) Cells were exposed to 32.6 µM BrdU for 2 hr (32°) and then processed for BrdU and phospho-histone H2A (p-H2A) immunofluorescence. DNA was counterstained with DAPI. Merged image is BrdU and p-H2A signals. Bar, 10 µm.

