Figure 5 .
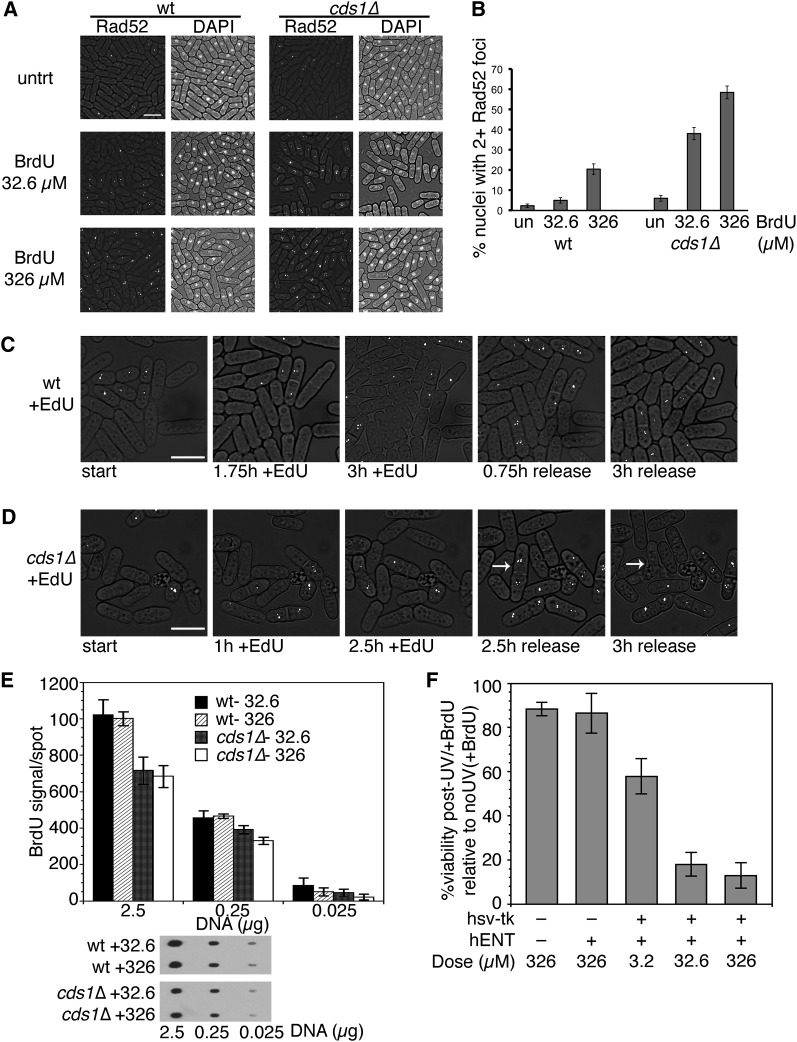
BrdU and EdU induce a DNA damage response. (A) Rad52-YFP foci were monitored in untreated cells (untrt) or after 3 hr BrdU at 32°. Rad52 foci (left) or DAPI-stained nuclei (right) are shown on a transmitted light background. Bar, 10 µm. (B) Quantification of three independent experiments in A. Shown are proportions of nuclei with two or more Rad52-YFP foci after 3 hr BrdU ± 95% confidence interval (C.I.). (C and D) Time points selected from movies of wild-type (C; and File S3) or cds1Δ (D; and File S4) cells treated with 10 µM EdU. Arrow (in D) indicates cell that forms foci and lyses. Bar, 10 µm. (E) BrdU incorporated is similar at 32.6 and 326 µM doses. Shown is the mean BrdU signal per dot (±SEM, three independent experiments) at 2.5, 0.25, or 0.025 µg of heat-denatured total DNA, blotted and detected with BrdU antibody. Below, example of BrdU detection on DNA spots. (F) Wild-type nonincorporating or hsv-tk+ hENT+ cells were treated BrdU doses for 3 hr, plated on YES, and then irradiated with 100 J/m2 UV light. Comparison plates were not treated with BrdU, to calculate percentage of viability after BrdU+UV treatment. Shown is the mean viability after BrdU+UV relative to BrdU only, for three independent experiments ± SEM.

