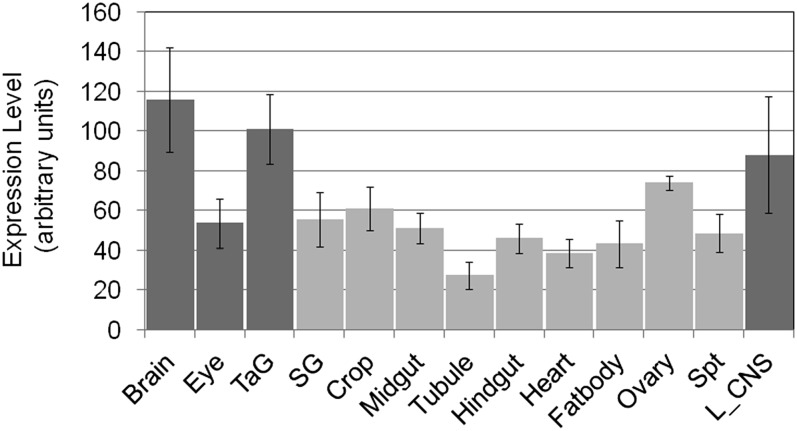
Figure 2 .
Average expression of candidate genes associated with sperm competition in different tissues. The mean expression levels of the 33 candidate genes are higher in neuronal tissues (dark shading) than in nonneuronal tissues (light shading) (P = 0.0019). Tissue-specific expression data were taken from FlyAtlas. TaG, thoracicoabdominal ganglion; SG, salivary gland; Spt, spermatheca; L_CNS, larval central nervous system. Mean ± SD is shown.

