Figure 7 .
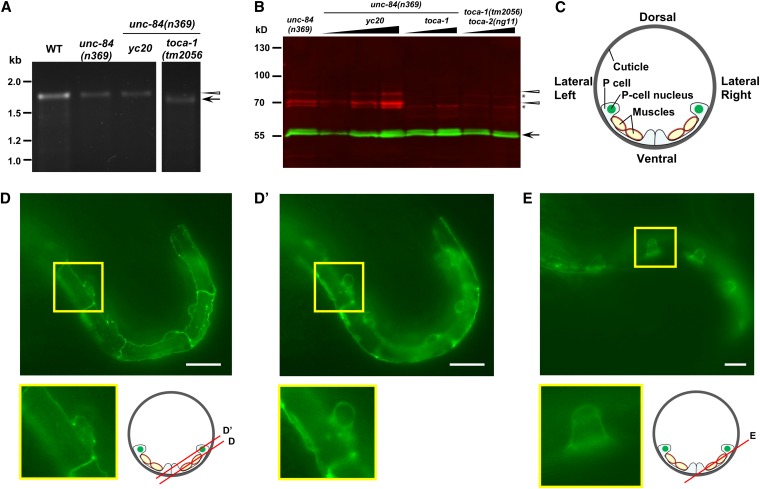
toca-1 expression and localization. (A) RT-PCR from mRNA amplified a 1.7-kb band of the expected size (arrowhead) in N2, unc-84(n369) and toca-1(yc20) unc-84(n369) animals. A 1.6-kb band of the expected size (arrow) was amplified from toca-1(tm2056) unc-84(n369) RNA. (B) On Western blots, anti–TOCA-1 antibodies recognized a doublet (red, marked with arrowheads) of the expected size of ∼70 kDa in both unc-84(n369) and toca-1(yc20) unc-84(n369) animals. As expected, both bands of the TOCA-1 doublet were absent from toca-1(tm2056) unc-84(n369) and toca-1(tm2056) toca-2(ng11) animals. Nonspecific bands were marked with asterisks. α-Tubulin (55-kDa band in green, marked with an arrow) was used as loading control. (C) Schematized section of an early L1 animal. Underneath a sheath of cuticle, P cells are the epidermis that covers the lateral-to-ventral side of the animal. P cells are very thin where they are over muscles. P-cell nuclei localize to the lateral side before the nuclear migration occurs. (D and E) TOCA-1::GFP expression in P cells of early (D and D′) and mid-L1 (E) animals. Two planes of focus as diagramed in the cartoon, one at the lateral surface (D) and one farther inside (D′), are shown for the same animal. Insets are enlargements of the indicated boxes. Bars: 10 μm.

