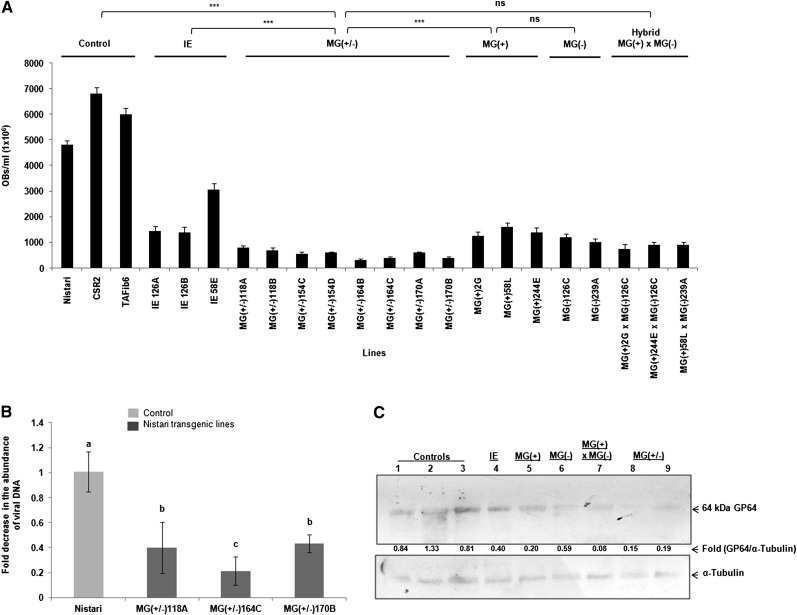
Figure 3 .
Viral accumulation as measured by OBs titer in transgenic and nontransgenic lines. (A) Virus load was determined by scoring the OBs from hemolymph of BmNPV-infected larvae. The number of OBs is much lower in transgenic lines in comparison to nontransgenic control lines. Bar indicates SD, N = 36. (***) P < 0.001; ns, not significant. (B) Quantitative PCR analysis of lef3 gene of BmNPV to determine the viral load in the hemolymph of infected transgenic and nontransgenic larvae. Three independent experiments were carried out in duplicates, with a set of five larvae and the results were normalized against endogenous 18S rRNA gene. The bars denoted by different letters differ significantly (P < 0.001). (C) Western blot showing reduced expression of viral coat protein in transgenics compared to nontransgenic moths. Western analysis was performed using anti-GP64 antibody. Lane 1, control CSR2 line; lane 2, TAFib, a transgenic line that expresses nontarget dsRNA; lane 3, control Nistari line; lane 4, transgenic line (IE 126A) with single viral gene target; lane 5, transgenic line MG(+)58L with segments of four viral target genes transcribed in sense orientation; lane 6, transgenic line MG(−)126C with segments of four viral genes transcribed in antisense orientation; lane 7, transgenic hybrid line MG(+)58L × MG(−)126C obtained by crossing MG (+) and MG (−) lines; lanes 8 and 9, transgenic lines MG(+/−) (164C and 170A) lines with four essential baculoviral target genes expressing in sense and antisense orientation.

