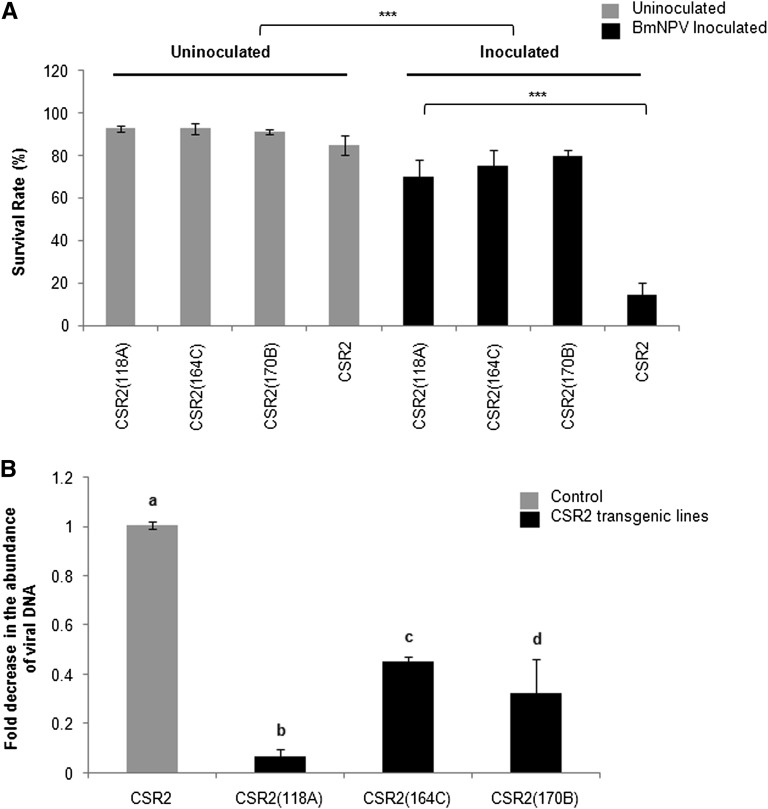
Figure 6 .
Performance of CSR2 transgenic MG(+/−) (118A, 164C, and 170B) lines obtained from recurrent backcross population (BC4F13 batch). (A) Survival rate as compared to BmNPV-infected lines. Statistical significance (P) was calculated by Student’s t-test. Bar indicates SD, N = 24. (***) P < 0.001. (B) Quantitative PCR analysis of BmNPV using lef3 as a target gene to determine the viral load in the CSR2 transgenic and nontransgenic lines infected with 6000 OBs/larva. Three independent experiments were carried out in duplicates with a set of five larvae each, and the results were normalized against endogenous 18S rRNA gene. The bars denoted by different letters differ significantly (P < 0.001).

