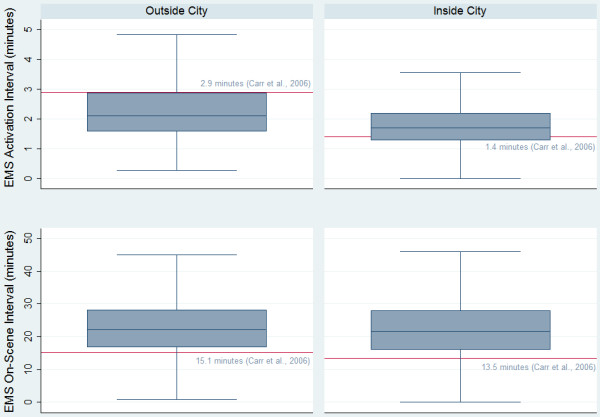
Figure 1.

Comparison of literature derived and actual activation and on-scene intervals. This figure shows the actual EMS activation interval times (top two boxplots) and on-scene interval times (bottom two boxplots) in comparison to the previously published average times found through a US meta-analysis conducted by Carr et al. (2006) shown as the horizontal red line.
