
Figure 1.
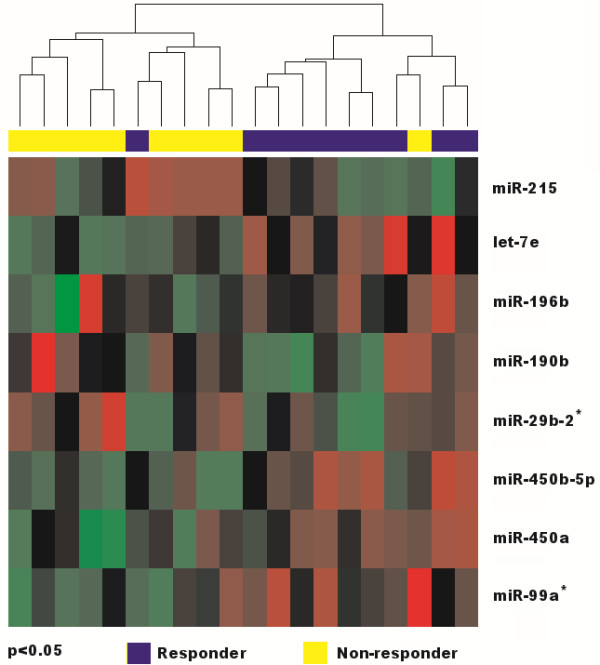
Hierarchical clustering of 10 responders and 10 non-responders to neoadjuvant chemoradiotherapy stratified according to the expression profile of 8 miRNAs differentially expressed between these two groups. Yellow color indicate samples of non-responders, blue responders to neoadjuvant therapy, p<0.05.