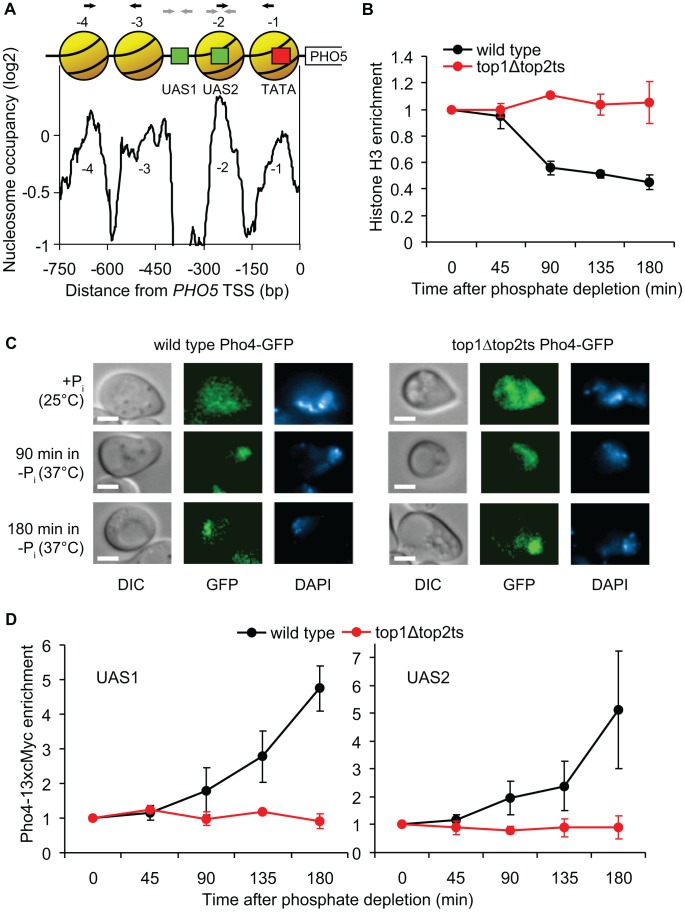
Figure 7. Topoisomerases are essential for binding of the Pho4p transcription factor.
(A) Nucleosome occupancy profile of the PHO5 promoter [35]. Positioned nucleosomes (yellow), which are removed upon PHO5 induction, are denoted −1 to −4 relative to the transcription start site (TSS). Red box indicates TATA box and green boxes indicate upstream activating sequences, UAS1 and UAS2, which both contain a Pho4p binding site. Black and grey arrows indicate the primers used in the H3 and Pho4-13xcMyc ChIP experiments, respectively. (B) Time course ChIP analysis of nucleosome removal from the PHO5 promoter in wild-type and top1Δtop2ts cells following transcriptional activation. Experimental setup was as described for Figure 5A. The plot depicts average levels of histone H3 in nucleosome regions −1 to −2 and −3 to −4, respectively, in the PHO5 promoter. H3 binding levels were normalized relative to the binding under un-induced conditions at the 0 min time point (set to 1). (C) Localization of Pho4-GFP was investigated by fluorescence microscopy in wild-type and top1Δtop2ts cells grown under high phosphate conditions (+Pi) at 25°C, and 90 and 180 min after shifting cells to phosphate-free medium (−Pi) at 37°C for inhibition of Top2p. The experimental setup was as described for Figure 5A. Differential interference contrast (DIC) and fluorescence (GFP) images of representative cells are shown, and the nuclei are indicated by DAPI (4′,6-diamidino-2-phenylindole) staining of DNA. Scale bars represent 2 µm. (D) Time course ChIP analyses of Pho4-13xcMyc recruitment kinetics in the PHO5 promoter in wild-type and top1Δtop2ts cells following transcriptional activation. The experimental setup was as described for Figure 5A. The plots depict levels of Pho4-13xcMyc binding to UAS1 (left panel) and UAS2 (right panel) in the PHO5 promoter, although the resolution of the ChIP assay may be insufficient to discriminate between the two sites, and Pho4p binding at the low affinity UAS1 site may be below the detection threshold of the assay. Pho4-13xcMyc binding levels were normalized relative to the binding under un-induced conditions at the 0 min time point (set to 1). In B and D averages from three individual experiments are shown and error bars represent ± one standard deviation.

