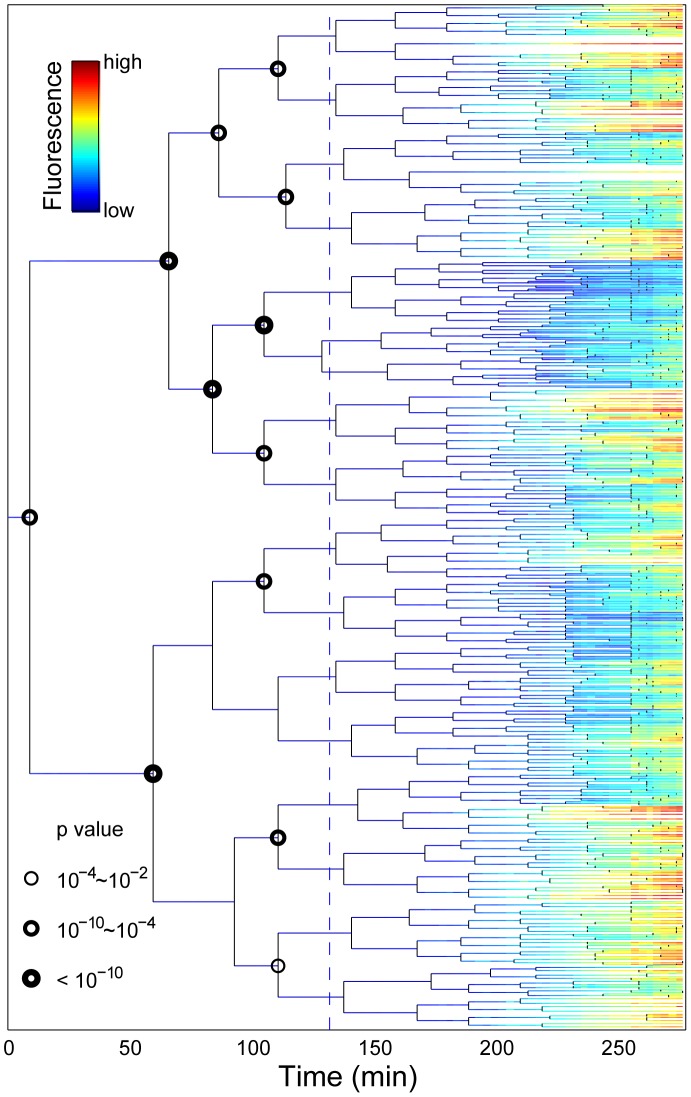
Figure 3. Stress-response propagation within micro-colony lineage trees reveals clustered pre-disposition events.
Each horizontal line represents the life history of a single cell. The line branches when the cell divides. The fluorescence intensity of the cells is indicated by the colour code. The dashed line represents streptomycin addition. The nodes where the progeny of the sister progenitor cells have a significantly different fluorescence profiles at the end of the experiment are marked with a circle. Only nodes prior stress are considered. Different sizes of the circles indicate the p-value of T-test. Data correspond to Video S2.

