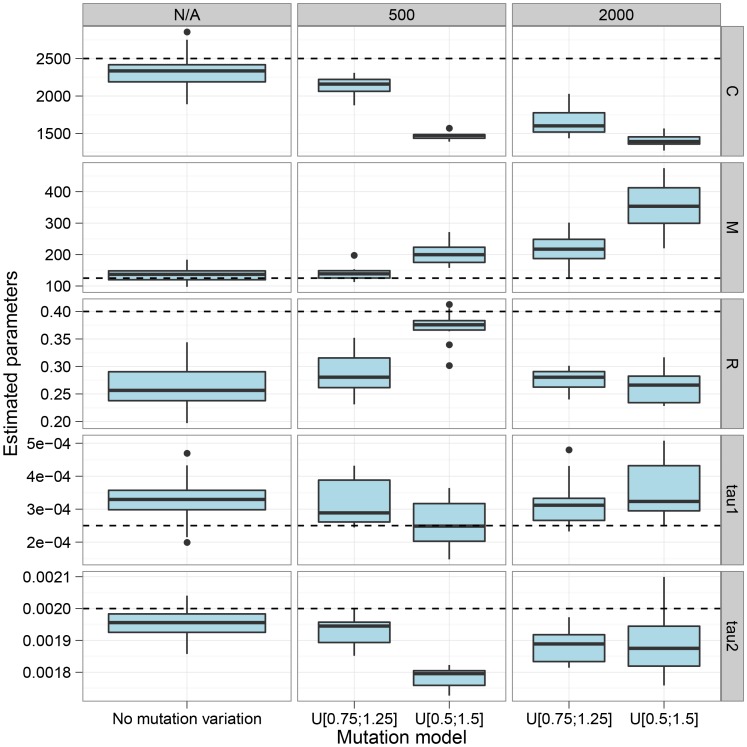
Figure 3. The effect of mutation rate variation.
The figure shows the effect on parameter estimation when the mutation rate is varied along the genome alignment. We split the alignment into segments geometrically distributed with mean length 500 bp and 2 kbp, and the mutation rate is then scaled by a random value chosen uniformly in the range 0.75 to 1.25 or 0.5 to 1.5. The dashed lines show the simulated values. The largest effect on varying the mutation rate is seen in the top-most parameters, the coalescence rate and the mutation rate. Varying the mutation rate increases the variance in coalescence times scaled with mutation rate, which is interpreted by the model as a decreased coalescence rate, while segments with low mutation rates are seen as more recent coalescence rates which the model interprets as evidence for migration. Consequently, variation in mutation rate decreases our estimates of the coalescence rate and increases our estimates of migration rates.

