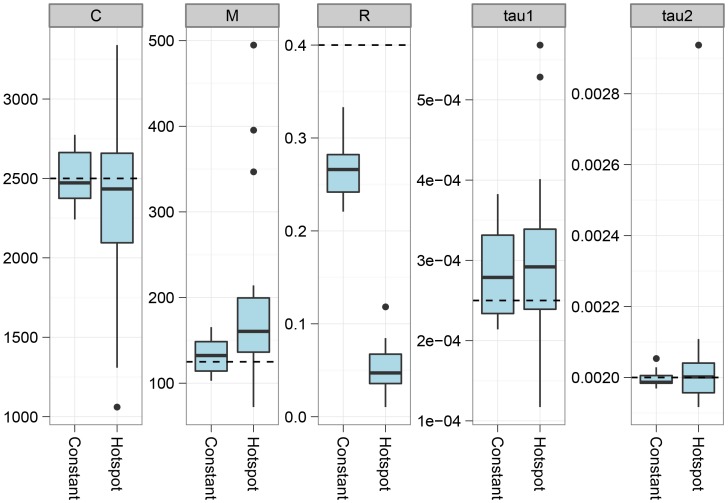
Figure 4. The effect of recombination rate variation.
The figure shows the effect on parameter estimation when the recombination rate is varied along the genome alignment. To simulate variation in the recombination rate, we sampled random 10 Mbp segments of the human genome, extracted the DeCODE recombination map for these segments, and scaled the recombination rate in the simulations according to the variation in this map. The dashed lines show the simulated values of the parameters. For most parameters, the effect of varying the recombination rate is seen as an increased variance in the estimates, while they do not appear to be biased. The exception is the recombination rate that becomes even more underestimated than for a constant recombination rate.

