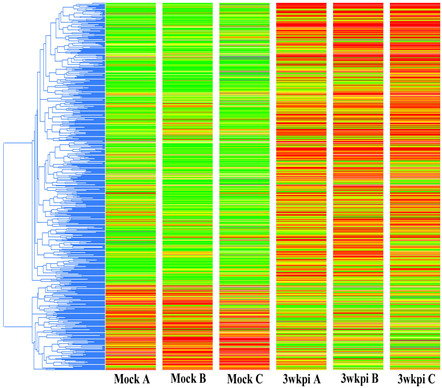
Figure 2.

Differentially expressed probe set in ependymal cells. Hierarchical cluster analysis of the differentially expressed probe sets by two or more fold; 563 probe sets were significantly affected, (red = upregulated, green = downregulated). Mock A, B and C represent individual biological samples from infected animals (n = 3). Three-week p.i. A, B and C represent individual biological samples from M. corti-infected mice (n = 3).
