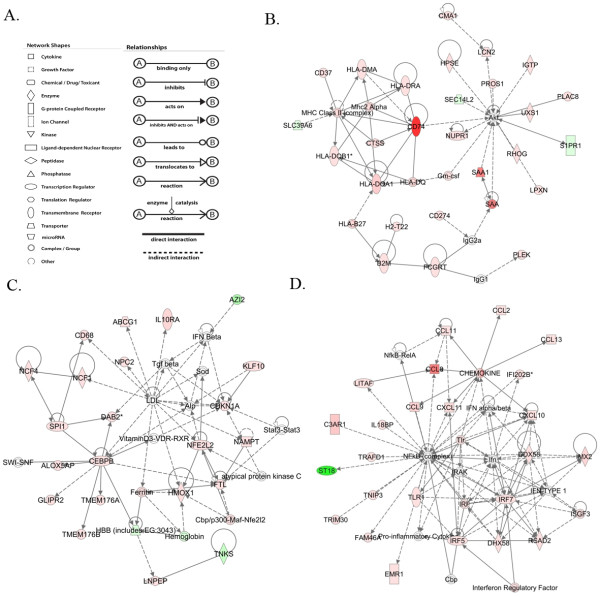
Figure 3.
Schematic representation of the most significant networks predicted by IPA. (A) Shape and relation legends. (B) Antigen presentation, inflammatory response, immunological disease. (C) Small molecule biochemistry, carbohydrate metabolism, molecular transport. (D) Antimicrobial response, inflammatory response, cell-to-cell signaling interaction. Red shape represents upregulated, green shape represents downregulated, and white boxes represent genes not present in the data sets but relevant to biological pathways and incorporated to generate networks.

