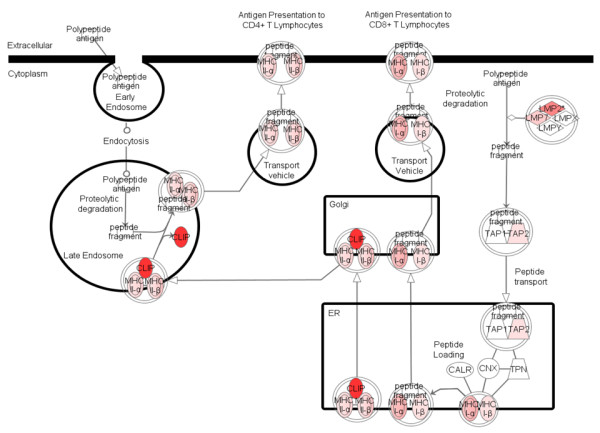
Figure 4.

Schematic representation of the most significantly affected pathway: “Antigen presentation pathway.” (Red indicates upregulated genes in the ependymal cells from infected brain in comparison to ependymal cells from mock-infected brain samples.).
