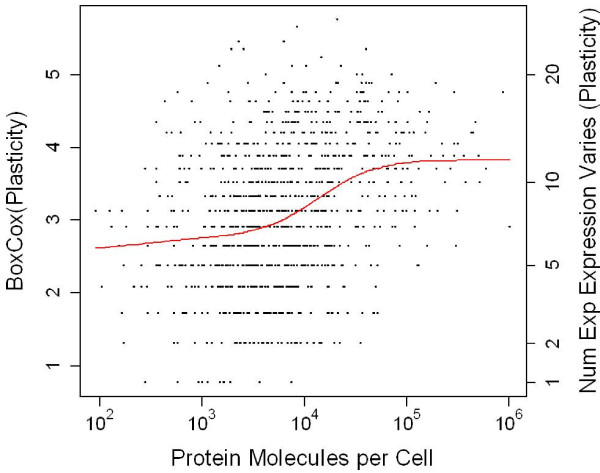
Figure 6.
Loess regression correcting plasticity for protein abundance. Statistical analyses were performed on transformed plasticity numbers (left vertical axis), untransformed plasticity is shown right for illustration. Further analysis was performed on the deviate of each data point from the red loess regression line. The R loess regression function was used rather than the lowess function because loess returns residuals and better handles larger datasets.

