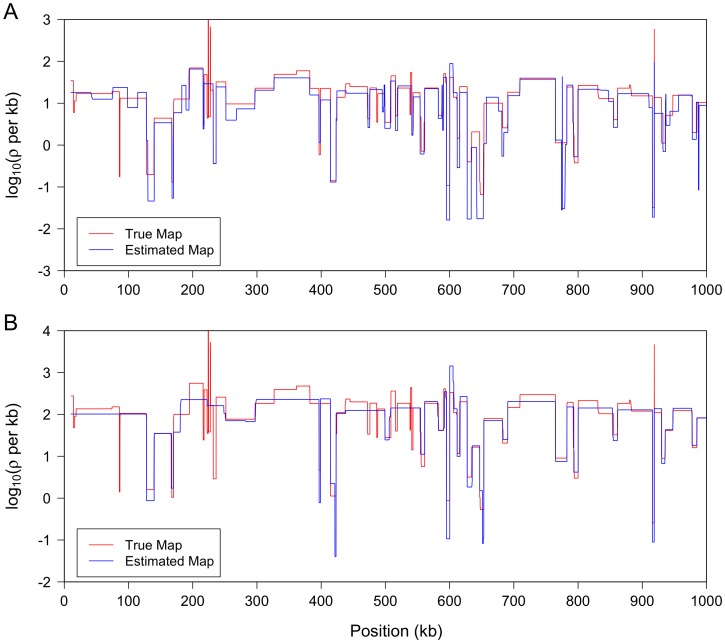
Figure 2. LDhelmet results on simulations with realistic variable recombination rates.
In each study, the program MaCS [72] was used to simulate data, with sample size 22, for a 1 Mb region with the variable recombination map shown in red. (We used  ; output was postprocessed to incorporate an empirical quadra-allelic mutation model.) Estimated recombination maps are shown in blue. The same block penalty of 50 was used in both cases. (A) The average recombination rate for the region is
  per kb, representative of the interior of the North American X. (B) The average recombination rate for the region is
  per kb, representative of the interior of the African X.

