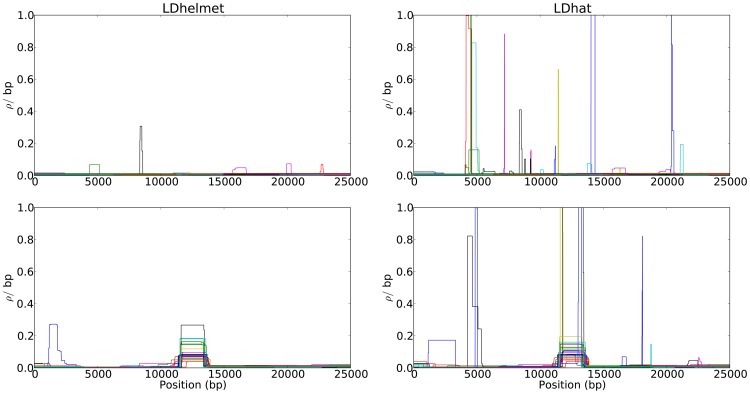
Figure 3. Comparison of the results of LDhelmet and LDhat for 25 datasets simulated under strong positive selection.
In each plot, different colors represent the results for different datasets. The left and right columns show the estimated recombination maps of LDhelmet and LDhat, respectively, using the same block penalty of 50. In each simulation, the selected site was placed at position  kb and the population-scaled selection coefficient was set to
  . The fixation time of the selected site was
  coalescent unit in the past. Although the estimated recombination maps are in general noisier than that for the neutral case (c.f., Figure 1), LDhelmet is more robust than LDhat. As illustrated in the plots, LDhat produces false inference of elevated recombination rates near the selected site more frequently than does LDhelmet. The same scenarios of recombination patterns as in Figure 1 were considered: (First Row) with a constant recombination rate of
  per bp, and (Second Row) with a hotspot of width
  kb starting at location 11.5 kb. The background recombination rate was
  per bp, while the hotspot intensity was
  the background rate, i.e.,
  per bp. The maps are shown in their entirety, including potential edge effects.

