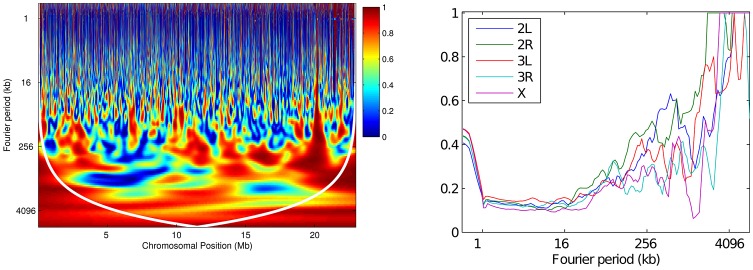
Figure 11. Wavelet coherence analysis comparing RAL against RG.
(Left): Wavelet coherence of the two maps for chromosome arm 2L. The cone of influence is shown in white. (Right): For each arm, the plot shows the fraction of the genome with significantly high coherence at the 5% level, at each scale.

