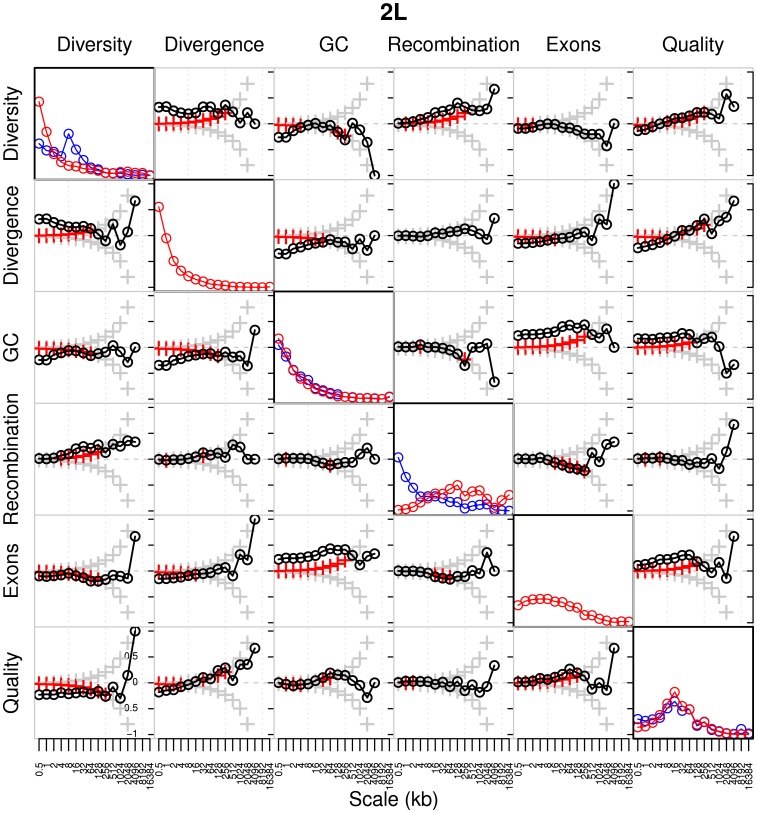
Figure 12. Global wavelet power spectrum and pairwise correlations of detail wavelet coefficients of RAL and RG data for chromosome arm 2L.
Diagonal plots show the global wavelet power spectrum of each feature of the RAL (blue) and RG (red) data. Off-diagonal plots show Kendall's rank correlation between pairs of detail coefficients at each scale, with respect to the wavelet decomposition of the two indicated features. Crosses denote the correlation that would be required for significance at the 1% level in a two-tailed test; red crosses are those scales at which the correlation is in fact significant. The bottom left and top right plots correspond to RAL and RG, respectively.

