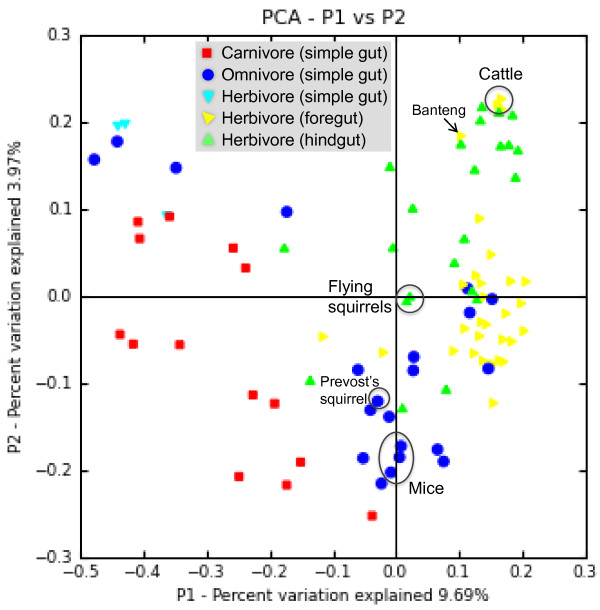
Figure 1.
Relationships of gut bacterial communities using principal coordinates analysis (PCoA) of the UniFrac metric matrix. Data included sequences from fermentation chambers (flying squirrels, cattle and mice) and from mammalian fecal samples [13]. The scores for the first 2 dimensions (P1 and P2) are plotted. Data for the cattle and mice were derived from [15] and [14], respectively.

