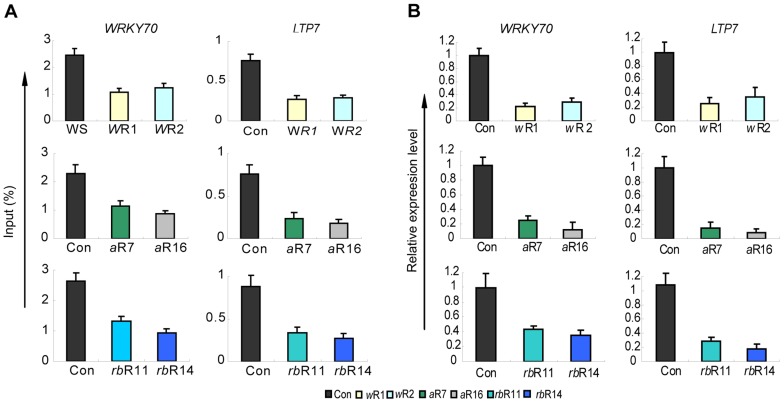
Figure 1. H3K4me3 and mRNA levels of two ATX1-regulated genes in the AtWRD5, or AtASH2, or At5-deficient lines.
A) Relative H3K4me3 levels at WRKY70 and LTP7 in control wild type plants transformed with the empty vector (Con), in AtWRD5-RNAi (wR1, wR2) lines (top panels), AtASH2-RNAi (aR7, aR16) lines (middle panels), and AtRbBp5a-RNAi (rbR11, rbR14) lines (bottom panels) as measured by ChIP-PCR with HK4me3-specific antibodies. For characterization of the RNAi lines see SF 1A, B). Specific primers used for each gene are at the 5′-end, at the peak of H3K4me3 accumulation (Region 2, as indicated in Figure 2A). Background levels for immunoprecipitated samples with IgG as a control in all genetic backgrounds were <0.001 of the input levels (not shown). ACT 7 is used as an internal control; B) Relative transcript levels produced by the genes in the RNAi knockdown lines described above. Each experiment was repeated at least three times. Each bar is standard errors of the mean (±SEMs, n = 3).

